This site is a testbed for implementing and adapting various features using the Hugo Relearn theme. It draws on some content from my 2019 PhD thesis, serving as a platform to experiment with new shortcuts, including:
Custom Hugo Shortcodes: Creating efficient shortcuts for dynamic content presentation.
MOLSTAR Integration: Embedding interactive 3D molecular structures for enhanced visualization.
Theme Adaptation: Customizing the Relearn theme to better suit specific use cases.
sdfsfe This is a test of the shortcode! sdfs
Subsections of About
1. Summary/Zusammenfassung
Subsections of 1. Summary/Zusammenfassung
Chapter 1
Summary 🇬🇧
Ribosomal protein biosynthesis (translation) is a crucial process in all
domains of life. This work aims to investigate the process of
translation in the mammalian system by means of single particle
cryogenic electron microscopy (cryo-EM). The focus of this thesis lies
on the following two aspects of mammalian translation:
1) Translocation by the mammalian cytosolic 80S ribosome. Translocation
moves the tRNA2•mRNA module directionally through the ribosome during
the elongation phase of translation and is associated with large scale
conformational changes within both the ribosome and the bound tRNAs. It
is catalyzed by the GTPase eEF2 (EF-G in bacteria). Although knowledge
on translocation, especially in the bacterial system, has accumulated in
the past years, the detailed mechanisms are not fully understood. In
particular, the role of GTP hydrolysis is controversial and structural
knowledge on translocation in the mammalian system has been missing.
In this work, three high-resolution structures of in vitro
reconstituted authentic intermediates of translocation by the mammalian
80S ribosome are presented. They are trapped by the non-hydrolysable GTP
analog GMPPNP and contain, in contrast to similar experiments in the
bacterial system, the translocase eEF2 and a complete tRNA•mRNA module.
Single-molecule imaging, carried out in collaboration with Prof. Scott
Blanchard and colleagues, revealed that GTP hydrolysis principally
facilitates rate-limiting, late steps of translocation, consistent with
the presented cryo-EM structures. Comparison with the bacterial system
showed that distinctions between bacterial and mammalian translocation
mechanisms originate from differential dissociation rates of deacylated
tRNA from the E site.
Further, a cryo-EM structure of a mammalian 80S ribosome containing a
complete tRNA2•mRNA module and eEF2•GDP is presented, which stems from a
sample prepared by in vitro translocating a PRE complex using
eEF2•GTP. In contrast to the GMPPNP-stalled translocation intermediates,
this structure gives insight into the interaction of unstalled eEF2 with
the 80S ribosome.
2) The influence of serum on the energy landscape of mammalian
translation and on the structure of ribosomal protein eS6. Serum
treatment of cells intervenes with many signaling pathways, but it is
not known if the energy landscape of translation is altered upon its
influence. Serum deprivation and restimulation can be used as a model
system to diminish and enhance phosphorylation of ribosomal protein eS6,
which is a eukaryote-specific protein on the small ribosomal subunit.
The phosphorylation of the C-terminus of eS6 has been investigated since
a long time, however, its mechanistic role has not been elucidated yet.
In particular, hardly anything is known on possible structural impacts
of eS6 phosphorylation.
The presented work reveals that serum deprivation and restimulation do
not have an impact on the energy landscape of translation for the ex
vivo derived cytosolic fraction of polysomes. However, the observation
of different yields of cell lysate from serum deprived and restimulated
cells led to the proposition of a new hypothesis that suggests cellular
redistribution of ribosomes. The phosphorylation of ribosomal protein
eS6, which strongly correlates with serum treatment, does not lead to
observable structural changes in the small ribosomal subunit.
Finally, the structural analysis and in silico sorting of the obtained
translation intermediates led to the identification of two previously
not observed substates of the 80S rotated PRE ribosome and to the
unprecedented visualization of two distinct, native inititation
complexes.
Chapter 2
Zusammenfassung 🇩🇪
Die ribosomale Proteinbiosynthese (Translation) ist ein zentraler
Prozess in allen Lebensdomänen. In der vorliegenden Arbeit wird der
Mechanismus der mammalischen Translation mithilfe der kryogenen
Elektronenmikroskopie (cryo-EM) untersucht. Der Fokus liegt hierbei auf
den folgenden zwei Aspekten der mammalischen Translation:
1. Die Translokation durch das mammalische, zytosolische 80S Ribosom.
Die Translokation ist die gerichtete Bewegung des tRNA2•mRNA Moduls
durch das Ribosom während der Elongationsphase der Proteinbiosynthese
und ist mit umfangreichen Konformationsänderungen des Ribosoms und der
gebundenen tRNAs assoziiert. Sie wird durch die GTPase eEF2 (EF-G in
Bakterien) katalysiert. Obwohl während der vergangenen Jahre viel über
die Translokation, vor allem im bakteriellen System, zusammengetragen
wurde, bleibt der genaue Mechanismus unverstanden. Insbesondere die
Rolle der GTP-Hydrolyse ist kontrovers und es fehlen strukturelle Daten
über die Translokation im mammalischen System.
In dieser Arbeit werden drei hochaufgelöste Strukturen in vitro
rekonstituierter, authentischer Translokationsintermediate des
mammalischen 80S Ribosoms präsentiert. Sie konnten mithilfe des
nicht-hydrolysierbaren GTP-Analogons GMPPNP eingefangen werden und
enthalten im Gegensatz zu ähnlichen Experimenten im bakteriellen System
die Translokase eEF2 und ein komplettes tRNA2•mRNA Modul. Die in
Kollaboration mit Herrn Prof. Scott Blanchard und seinen Kollegen
durchgeführte Einzelmolekül-Bildgebung ergab, dass die GTP-Hydrolyse
hauptsächlich späte, geschwindigkeitslimitierende Schritte der
Translokation fördert, eine Beobachtung, die in Einklang mit den
präsentierten cryo-EM Strukturen steht. Der Vergleich mit dem
bakteriellen System schließlich zeigt, dass Unterschiede zwischen
bakteriellen und mammalischen Translokationsmechanismen in verschiedenen
Dissoziationsraten der deacylierten tRNA von der E Stelle begründet
sind.
Desweiteren wird die cryo-EM Struktur eines mammalischen 80S Ribosoms
mit einem kompletten tRNA2•mRNA Modul und eEF2•GDP präsentiert, welche
aus einer Probe stammt, für deren Herstellung ribosomale Prä-Komplexe in
vitro mit eEF2•GTP transloziert wurden. Anders als die mit eEF2•GMPPNP
eingefangenen Translokationsintermediate gewährt diese Struktur Einblick
in die Interaktion von unmanipuliertem eEF2 mit dem 80S Ribosom.
2) Der Einfluss von Serum auf die Energielanschaft der mammalischen
Translation und auf die Struktur des ribosomalen Proteins eS6. Die
Behandlung von Zellen mit Serum greift in viele Signalwege ein, doch es
ist nicht bekannt, ob auch die Energielandschaft der Translation
beeinflusst wird. Serum-Deprivation und -Stimulation kann als
Modellsystem für die Verringerung und Steigerung der Phosphorylierung
des ribosomalen Proteins eS6, einem Eukaryoten-spezifischen Protein der
kleinen ribosomalen Untereinheit, angewendet werden. Die
Phosphorylierung des C-Terminus von eS6 wird seit langer Zeit erforscht,
jedoch ist ihre mechanistische Bedeutung bisher unbekannt. Vor allem
weiß man kaum etwas über mögliche strukturelle Auswirkungen der
eS6-Phosphorylierung.
Die vorliegende Arbeit zeigt, dass Serum-Deprivation und -Stimulation
keinen Einfluss auf die Energielandschaft der Translation in der
zytosolischen Fraktion der ex vivo gewonnenen Polysomen hat. Die
Beobachtung eines Unterschieds in den Zelllysatausbeuten zwischen
Serum-deprivierten und -stimulierten Zellen führte jedoch zu einer neuen
Hypothese, welche die zelluläre Umverteilung von Ribosomen nahelegt. Die
Phosphorylierung des ribosomalen Proteins eS6, welche stark mit der
Serumbehandlung korreliert, führte zu keinen sichtbaren strukturellen
Veränderungen in der kleinen ribosomalen Untereinheit.
Zu guter Letzt führte die Strukturanalyse und in silico Sortierung der
erhaltenen Translationsintermediate zu der Identifikation zweier bisher
nicht beobachteten Unterzustände des 80S rotierten Prä-Ribosoms sowie zu
der erstmaligen Visualizierung zweier verschiedener, nativer
Initiationskomplexe.
1. Summary/Zusammenfassung
Subsections of 2. Introduction
Common principles of protein biosynthesis
A current theory states that it was RNA that stood at the beginning
of life on our planet (Gesteland, R.F., Cech, T.R., 1999). Yet, the later
appearing proteins outperformed RNA in so many fields that those
early, self-sufficient RNA constructs are now extinct. Whereas RNA
is composed by a combination of basically four different types of
nucleotides and is relatively limited in its ability to form tertiary
structure, proteins are highly flexible chains built from twenty amino
acids that can fold in a larger variety of three-dimensional shapes.
The amount of building blocks (twenty compared to only four in
RNA – leaving aside base modifications) equips them with a high
degree of adaptability to different tasks and might be the reason for
their superiority to RNA in many fields (
Figure 1).
To build such a peptide chain, amino acids have to be linked in
the correct order via peptide bond formation. Although there exist
proteins which are able to catalyze peptide bonds, like the sortase
(Mazmanian et al., 1999), in all kingdoms of life the responsibility for
building these peptide chains lies in a ribonucleoprotein particle: a
macromolecular machine called the ribosome.
General features of the ribosome
The ribosome consists of a large and a small subunit. Both are
made up of ribosomal RNA (rRNA) and ribosomal proteins (
Figure 1). The basic mechanism of protein synthesis is very similar in all
domains of life: A messenger RNA (mRNA) contains the sequence of
the protein and is bound and read by the small ribosomal subunit
in collaboration with specific transfer RNAs (tRNAs). tRNAs carry the
amino acids and contain characteristic anticodons, which establish base pairing with the respective codons on the mRNA presented to
them by the ribosome. Matching allows for addition of the amino
acid to the growing peptide chain. After all amino acids have been
added, the peptide chain is released from the ribosome and, if
needed, further processed by other cell components to become the
final, folded protein.
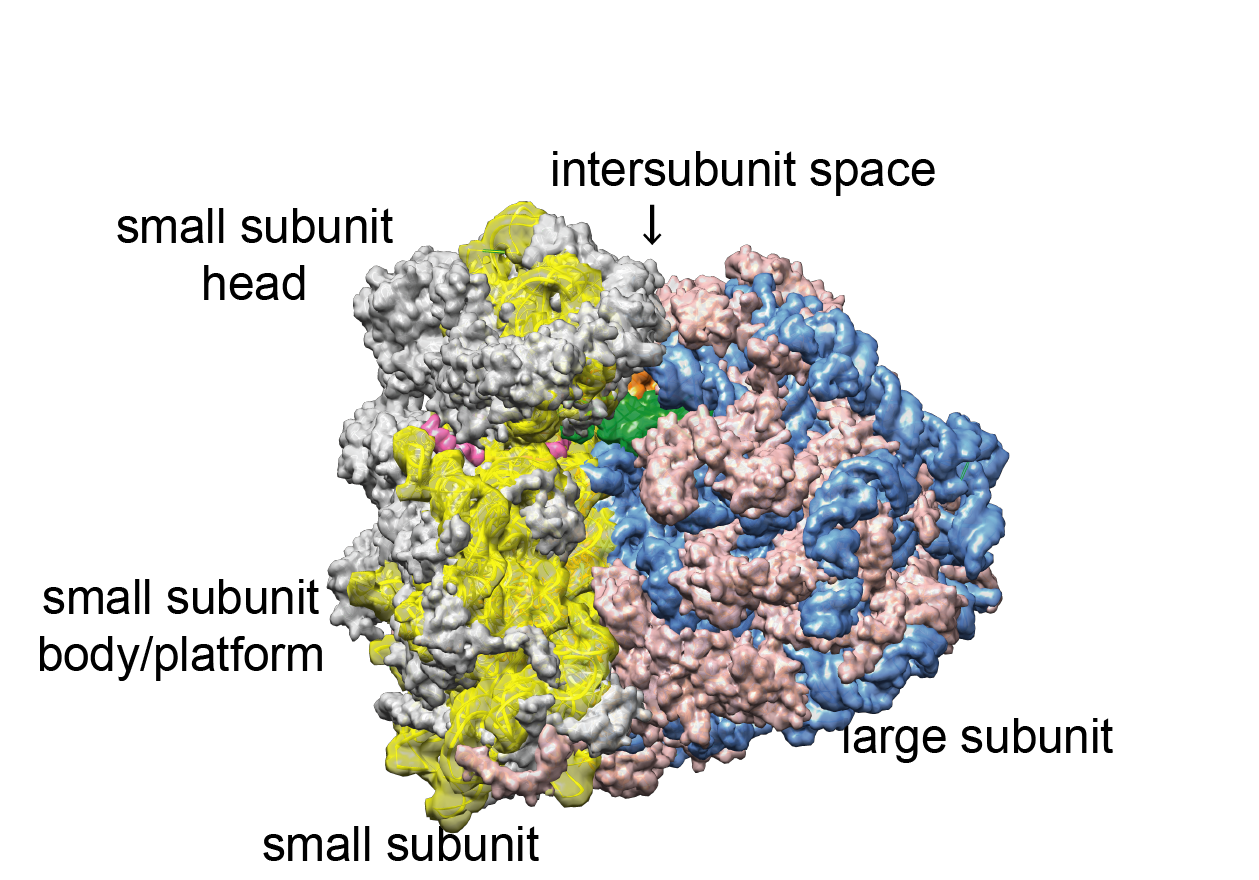
Figure 1:
The human cytoplasmic 80S ribosome. | Density calculated from atomic coordinates using the PDB-model 5aj0 (Behrmann et al., 2015). Blue: ribosomal RNA (rRNA) of the large subunit, rose: ribosomal proteins of the large subunit, yellow: ribosomal RNA of the small subunit, grey: ribosomal proteins of the small subunit. In the intersubunit space, two tRNAs are positioned at the P site (green) and the E site (orange). The atomic model does not contain all expansion segments in full length, because they could not always be modeled
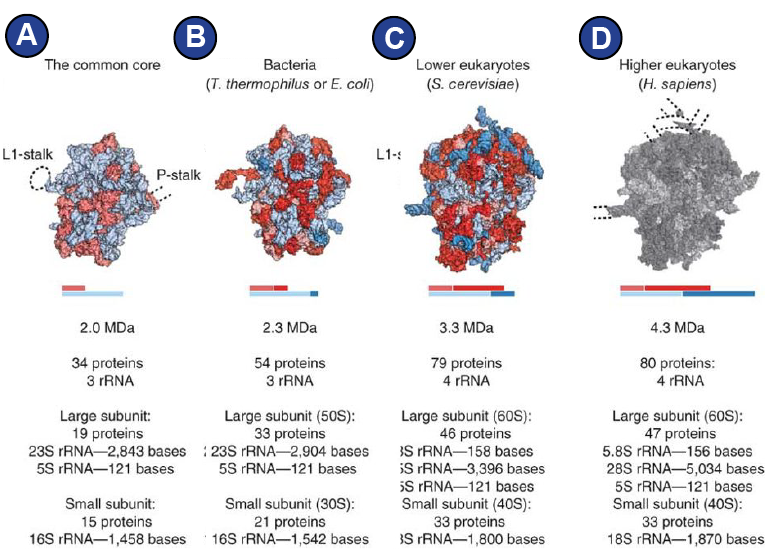
Although the three domains of life, bacteria, eukaryotes, and
archaea, all possess ribosomes for protein synthesis, the composition
of the ribosomes varies, leading to sometimes very different overall
appearance of ribosomes from different kingdoms of life (Amunts et
al., 2015; Behrmann et al., 2015; Dunkle et al., 2011; Melnikov et al.,
2012; Ramrath et al., 2018) (
Figure 2).
The eukaryotic cytoplasmic 80S ribosome is larger than the bacterial
70S ribosome, containing additional RNA segments and additional
proteins. Comparison reveals that the eukaryotic ribosome possesses the same conserved structures as the bacterial ribosome in its core
(Figure 2A) and an outer shell where eukaryote-specific elements
are located (
Figure 1,
Figure 2) (Melnikov et al., 2012).
Not only the ribosomes themselves differ by certain features and are
differently sensitive to antibiotics (Yusupova and Yusupov, 2017),
but also the interacting factors that render translation possible are
for some stages of translation remarkably different (Andersen et al., 2006) and might be an expression of the way the ribosome has been
optimized for its bacterial, archaean, or eukaryotic cell environment.
Figure 2:
Ribosomes from different domains of life | Figure adapted from (Melnikov et al., 2012). (A) Conserved core composed of RNA (light blue) and proteins (light red). Ribosomes in each domain of life differ by additional or modified proteins (red), and additional rRNA segments (blue). Dashed lines around the core indicate positions of flexible stalks of the ribosome and are not shown in the other structures for simplicity. (B) 70S from bacteria. (C) 80S from S. cerevisiae. (D) A structure of the eukaryotic 80S was not available in 2012 and therefore is grey. An overview of the human 80S ribosome can be found in Figure 1.
Anatomy of the (mammalian) ribosome
The size of the assembled 80S mammalian ribosome is about 4.3
MDa (Wool, 1979). Both subunits are made of ribosomal RNA (rRNA)
and ribosomal proteins (Wool, 1979). Upon joining of the large 60S
(50S in bacteria) subunit and the small 40S (30S in bacteria) subunit
to the 80S ribosome (70S in bacteria), a functionally important
compartment is formed, the so-called intersubunit space (Figure
1), which is one of the main sites of action during protein synthesis.
Across it span three tRNA-binding sites, named A (Aminoacyl)-, P
(Peptidyl)-, and E (Exit)-sites. Additionally, the ribosome has specific
factor binding sites for the interaction with protein factors, like the
P-stalk (
Figure 3C-D).
rRNA is the catalytically active component of the ribosome
The rRNA possesses the catalytic activity to perform peptide bond
formation and is the main player in protein synthesis. The large (60S)
subunit contains three rRNA molecules: the 28S rRNA, the 5S rRNA
and the 5.8S rRNA (Supplemental Figure 1, Supplemental Figure
2). The small (40S) subunit contains only one rRNA molecule, the 18S
rRNA (Supplemental Figure 3). The rRNA regions responsible for
mRNA-recognition, tRNA-binding and peptidyl-transfer are highly
conserved in all kingdoms of life (Gesteland, R.F., Cech, T.R., 1999).
Among these conserved regions are the sarcin ricin loop (SRL) on
the large subunit, interacting with GTP-hydrolyzing protein factors
that catalyze certain steps of translation. In the peptidyltransferase
center (PTC), also located on the large subunit, the RNA alone is
responsible for catalyzing the formation of the peptide bond (Nissen
et al., 2000; Spahn et al., 2000). The small subunit 18S rRNA contains
the decoding center (DC), which monitors correct tRNA-anticodon
matching to the mRNA codon.
Different from bacterial rRNA, eukaryotic 18S rRNA and 28S rRNA
contain several expansion segments, long elements of additional rRNA that are to a great deal responsible for the big difference in
size between bacterial and mammalian ribosomes. The function
of these expansion segments is not yet clear, and their structural
investigation is hindered by their high flexibility and peripheral
location, making it very difficult to obtain high-resolution structural
information (Ramesh and Woolford, 2016; Yusupova and Yusupov,
2017). There is some evidence, however, that expansion segments
may play a role in ribosome biogenesis (Ramesh and Woolford,
2016).
Despite the rRNA’s prominent role in translation, the ribosome
would not function without ribosomal proteins. They are important
for rRNA folding and assembly and stabilize the tertiary structure of
rRNA and the ribosome’s functional centers. There are 33 ribosomal
proteins on the 40S and 47 ribosomal proteins on the 60S subunit
of the mammalian ribosome. Following a recent convention (Ban
et al., 2014) universally conserved proteins are prefixed ‘u’, unique
bacterial ones ‘b’, unique eukaryotic ones ‘e’, and unique archaeal
ones ‘a’ (Supplemental Figure 4, Supplemental Figure 5).
The three-dimensional shape of the ribosome is optimized for its function
The 40S subunit can be morphologically divided into several
regions, named after the 40S subunit’s resemblance in shape to
a bird: Looking at it from the solvent site, on top is the 40S ‘head’
with its prominent ‘beak’, below follows the ‘neck’, and the ‘body’ is
supplemented by the ‘platform’, ‘shoulder’ and ‘foot’ domains (Figure
3A). In this work, a rough division into two parts will be used: the 40S
head (including beak) and the 40S body/platform, comprising the
remaining domains. Importantly, the link between the 40S head and
40S body/platform is flexible and allows for intrasubunit motions.
Visible from the intersubunit space, there are the three 40S tRNA
binding sites that are distributed among the 40S head and 40S body/
platform: A, P, and E (
Figure 3B). The rRNA residues that constitute
the tRNA binding sites are well-conserved (Supplemental Figure 1,
Supplemental Figure 2, Supplemental Figure 3).
The large (60S) subunit is characterized by several landmarks; The
central protuberance, the P-stalk/stalk base and the L1 stalk (
Figure 3C-D). From the solvent side, one can see the ribosomal exit tunnel,
from which the newly synthesized protein emerges. The solvent side
is to a large degree covered by expansion segment ES7, the largest
expansion segment of the 28S rRNA (
Figure 3C). Looking on the 60S
from the intersubunit space reveals the A-, P-, and E-tRNA binding
sites and the sarcin-ricin loop (SRL) (
Figure 3D).
Figure 3:
Anatomy of the mammalian ribosome. | 40S (A,B) and 60S (C,D) subunits of the human ribosome, density calculated from PDB-5aj0 (Behrmann et al., 2015). Blue: ribosomal RNA (rRNA) of the 60S subunit, rose: ribosomal proteins of the 60S subunit, yellow: ribosomal RNA of the 40S subunit, grey: ribosomal proteins of 40S subunit. (A, B) The 40S subunit possesses the following main landmarks: head, beak, neck, shoulder, platform, body, left and right foot. (A) The head is characterized by RACK1 protein, h39, and the promsinent beak, including eS31 and h33. Between h33 and h16, there is a latch which can widen and narrow depending on the intrasubunit motions, which take place around the flexible neck. (B) The intersubunit face of the 40S subunit is dominated by the long h44. The three tRNA binding sites on the 40S subunit are indicated ‘A’ (aminoacyl), ‘P’ (peptidyl), and ‘E’ (exit). (C, D) The main anatomical landmarks of the 60S subunit are the central protuberance, the L1-stalk, and the stalk base of the P-stalk. (C) The 60S subunit’s solvent side is dominated by expansion segment 7 (ES7). From the ribosomal exit tunnel, the synthetized peptide chain leaves the ribosome. (D) The three tRNA binding sites on the 60S subunit are indicated ‘A’,‘P’, and ‘E’. In proximity to the A site, there is the highly conserved Sarcin-Ricin-Loop (SRL).
The main interaction partners of the ribosome
To carry out translation of an RNA template into a protein, the
ribosome is dependent on a large set of molecules – mRNAs, tRNAs,
protein factors and energy carriers.
Messenger RNA (mRNA) contains the protein sequence
The information on the sequence of amino acids is encoded in the
DNA of a cell and has to be transferred to RNA first (paradigm of
molecular biology (Crick, 1970)). Such RNA, which serves as template
for protein synthesis, is called messenger RNA (mRNA). Its production
involves transcription by polymerase II and processing steps such
as splicing, polyadenylation and capping (Meister, 2011). The mRNA
pool accessible to the ribosome is strictly controlled by a balance
between production and decay, variation of polyadenylation,
storage in P-bodies, and many other mechanisms that are not well
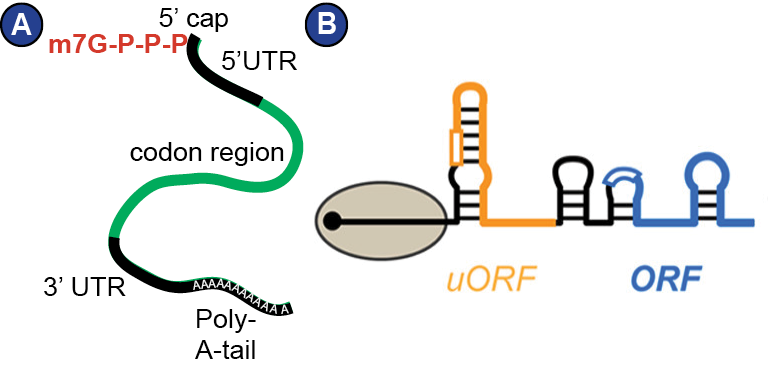
understood yet (Meister, 2011). In eukaryotes, mature mRNA is
characterized by a 5’ cap, a 5’ UTR (untranslated region), the coding
region, a 3’ UTR, and a poly-A-tail (
Figure 4). Notably, the mRNA
is intensely decorated with proteins that regulate its transport,
stability, decay and translation, for example poly-A-binding proteins
(PABPs). Thus, mRNA really is a messenger ribonucleoprotein (mRNP)
(Mitchell and Parker, 2014). Moreover, mRNA forms secondary
structure that influences its interaction with the ribosome (
Figure 4B). The entirety of the cellular mRNAs produced for translation at a
given time-point is called transcriptome, and the actually translated
mRNAs in a cell at a given timepoint constitute the translatome.
Figure 4:
Messenger RNA (mRNA). | (A) Schematic representation of a eukaryotic mRNA after processing, ready to be translated. The 5’-cap is a 5-methylguanosin that is connected to the RNA-5’-end via a triphosphate. The codon region starts with a start codon and ends with a stop codon. In reality, there are many proteins decorating the mRNA, such that it actually is an mRNP. (B) The secondary structure of an mRNA also plays an important role in the regulation of translation, especially translation initiation. The most common secondary structure elements are RNA hairpins. The figure is from (Mustoe et al., 2018) and schematically depicts an mRNA with two open reading frames (ORF) being translated by the ribosome (grey disc). The upstream open reading frame (uORF) is depicted in orange.
Transfer RNAs (tRNAs) allow for exact selection and incorporation of amino acids
tRNAs are specialized RNA molecules that usually consist of around
76 nucleotides. Their role in translation is to deliver the amino
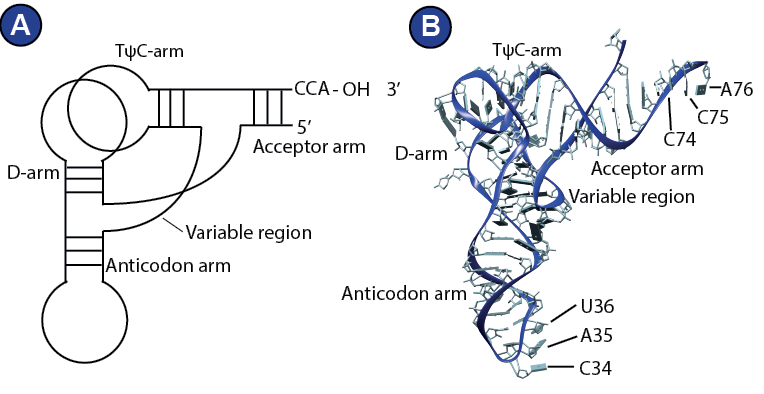
acids to the ribosome. Structurally, a tRNA consists of two parts,
top and bottom, which organize into an L-shaped tertiary structure
(Gesteland, R.F., Cech, T.R., 1999).
The top half comprises the TΨC-arm and the acceptor arm with
the CCA-end, which is loaded with the amino acid by specialized
enzymes, aminoacyl-transferases. There are elongator tRNAs and
initiator tRNAs. Initiator tRNAs (tRNAi) are always loaded with a methionine. The bottom half of a tRNA consists of the D-arm and
the anticodon loop, which can decode the mRNA (
Figure 5). The
tRNA nucleotides are often and extensively modified and these
modifications are thought to be important for its structure and
function (Meister, 2011). The life of tRNA outside of the ribosome
is object of intensive research and much less is known about it
than about its role on the ribosome. The modification of a tRNA, for
example, is complex and includes big protein complexes (Dauden
et al., 2017). Further, like the mRNA, the tRNA does not exist in
the cytosol as free and naked RNA molecule. The eukaryotic cell
operates an elaborate system that channels the tRNAs to and
from the ribosome, involving aminoacyl-transferases and probably
more factors (Andersen et al., 2006; Mirande, 2010; Stapulionis and
Deutscher, 1995).
Figure 5:
Transfer RNA. | (A) Schematic depiction of a tRNA showing the main features; anticodon arm, acceptor arm, D-arm and TψC-arm. This way of representing the tRNA is adapted from (Gesteland, R.F., Cech, T.R., 1999). (B) 3D structure of E. coli initiator tRNA (PDB 3CW5) (Barraud et al., 2008).
Translational GTPases tune the energy landscape of translation
Many protein factors are involved in translation by direct interaction
with the ribosome, the mRNA or the tRNA. A special subgroup of
protein factors involved in translation are translational GTPases. They
are GTP-hydrolyzing proteins that control key steps of translation; for example the decoding-specific eukaryotic elongation factor 1A
(eEF1A), or eukaryotic elongation facter 2 (eEF2), which is necessary
for efficient translocation, eukaryotic release factor 3 (eRF3), which
is responsible for stop-codon recognition and termination, and
eukaryotic initiation factor 5B (eIF5B), which mediates subunit
joining (see section ‘translation cycle’).
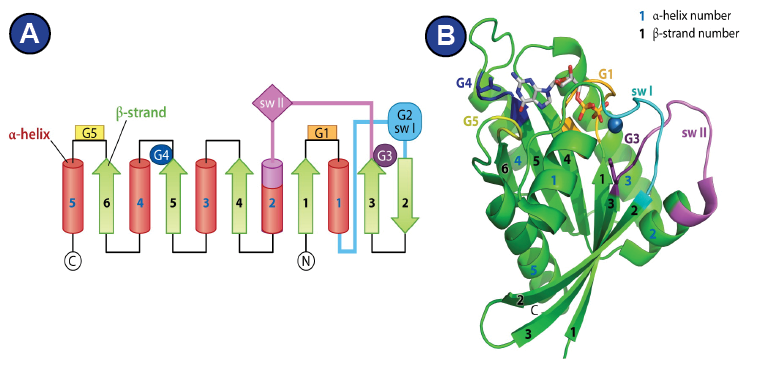
Figure 6:
Features of the G-domain. | (A, B) Figures adapted from (Wittinghofer and Vetter, 2011). (A) General organization of a G-domain on the level of secondary structure, alpha-helices are red, beta strands green. The localization of the G1-G5 motifs is indicated. (B) Three-dimensional structure of the G-domain of ras-GMPPNP•Mg2+ shows that the tertiary structure is an alpha-beta propeller.
Structurally, they all have in common the GTP-hydrolyzing domain
(G-domain), which forms an alpha-beta-propeller and contains the
nucleotide binding pocket (Wittinghofer and Vetter, 2011). Five
characteristic G-motifs (G1-G5) and three loops (P-loop, switch I,
switch II) organize around the bound nucleotide and characterize
the G-domain (
Figure 6; Supplemental Figure 6 shows alignment
of the G-domain of EF-G/eEF2 from different species). The G1 motif
is also known as Walker A motif and is located within the P-loop.
It is responsible for phosphate binding. The Mg2+ that is required
for nucleotide binding is positioned by the G2 motif and the G3
motif. The G2 motif is part of switch I, whereas the G3 motif (also
known as Walker B motif), is located within switch II (Bourne et al.,
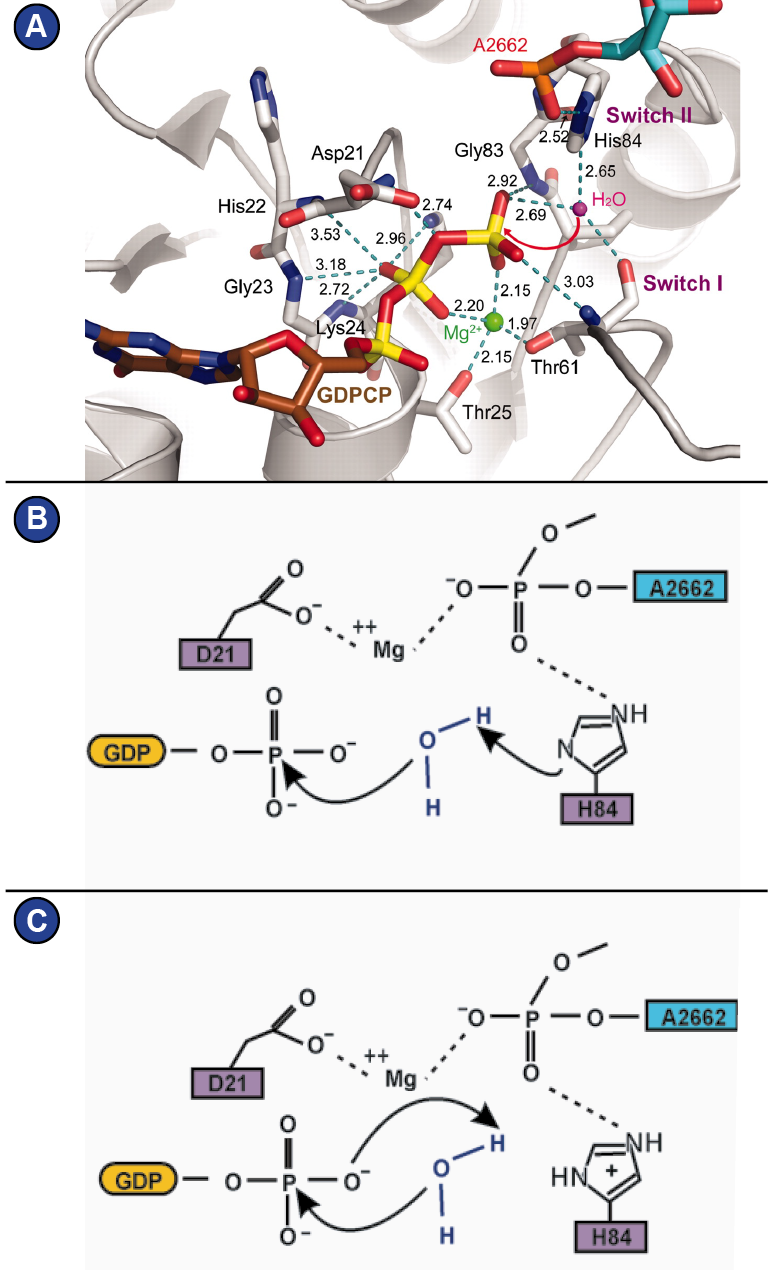
1991; Wittinghofer and Vetter, 2011) (Figure 6). GTP-hydrolysis is
achieved by a nucleophilic attack of an activated water molecule
and is assisted by the SRL of the ribosome, which serves as GTPase-activating factor for the translational GTPases. Depending on how
one interprets the role of a histidine of switch II (His 84 in eF-Tu,
His 108 in eEF2) (
Figure 7A), two mechanism are being proposed
that lead there: 1) A general base mechanism, in which the histidine
abstracts a proton from the water molecule (
Figure 7B), and 2) a
substrate-assisted mechanism, in which GTP itself abstracts a proton
from the water molecule while the histidine serves as allosteric
enhancer of this process (Figure 7C) (Liljas et al., 2011; Maracci and
Rodnina, 2016; Schweins et al., 1995; Voorhees et al., 2010).
Figure 7:
The G-domain. | (A) Atomic structure of the G-domain around the phosphates of the GTP molecule in EF-Tu (Model from (Voorhees et al., 2010), figure modified from (Liljas et al., 2011)). (B, C) Two proposed mechanisms of GTP-hydrolysis on EF-Tu, figure adapted from (Maracci and Rodnina, 2016). (B) General base mechanism. (C) Substrate assisted mechanism.
Ribosome dynamics reshapes interaction sites and defines functional states
Two main large scale motions can be observed in the assembled
ribosomes of all domains of life: rotation of the small subunit relative
to the large one and swivel of the small subunit head domain relative
to the small subunit body/platform domain (Figure 8A-B). The
combination of subunit rotation and head swivel, observed in early
ribosomal structures (Frank and Agrawal, 2000; Horan and Noller,
2007; Valle et al., 2003), was termed ‘ratcheting’. Subunit rotation and
head swivel result in a reshaping of the intersubunit space, leading
to changes in the positions of bound tRNAs and factors: Subunit
rotation is known to be associated with the movement of the tRNAs
on the large subunit (Moazed and Noller, 1989; Munro et al., 2007),
leading to hybrid tRNAs, meaning that the tRNA is bound to one
tRNA binding site on the small ribosomal subunit and to another
on the large ribosomal subunit (A/P, P/E tRNAs). Head swivel and
rotation combined (‘ratcheting’) are characteristic for the so-called
chimeric hybrid state, an intermediate of translocation (Ramrath et
al., 2013; Ratje et al., 2010; Zhou et al., 2013, 2014), where hybrid
tRNAs bind to different tRNA binding sites on the small ribosomal
subunit, one on the body/platform and another on the head domain (ap/P, pe/E tRNAs). Moreover, a somewhat ratcheted conformation is
also observed in inactive mammalian ribosomes bound to eukaryotic
elongation factor 2 (eEF2) (Khatter et al., 2015; Voorhees et al., 2014).
A motion so far only observed in the eukaryotic 80S ribosome is
rolling of the small subunit, a rotation around the small subunit’s
long axis (Figure 8A) (Behrmann et al., 2015; Budkevich et al., 2014). Subunit rolling takes place after decoding and is the main “net”
conformational change characterizing the transition from the pre-
translocational to the post-translocational state (See section 2.5).
Besides these main motions, there are some flexible parts of
the ribosome that have also been observed to adopt distinct
conformations: One of them is the L1 stalk (helices H76, H77, H78,
and protein uL1) on the 60S subunit (Figure 3C-D, Supplemental
Figure 1, Supplemental Figure 2), which is known to adopt different
positions depending on the functional state of the ribosome (Mohan
and Noller, 2017; Spahn et al., 2004a). Another flexible part is the
stalk base (Helices H42, H43, H44, and proteins uL10, uL11) on the
60S subunit (Figure 3C-D, Supplemental Figure 1, Supplemental
Figure 2). It changes its conformation by moving towards the A site
upon binding of different factors (Gao et al., 2007; Schuette et al.,
2009; Spahn et al., 2004b).
In 2009, Munro at al. applied the principle of the hierarchical energy
landscape (Frauenfelder et al., 1991) to the dynamics of translation
(Munro et al., 2009) (Figure 8C). The ribosome’s conformational
degrees of freedom are directly connected to the forward movement
of tRNAs during translation (Munro et al., 2009). The interplay of
thermodynamically spontaneous motions (like subunit rotation),
stabilizing and destabilizing contributions of the tRNAs (e.g. before
and after peptide bond formation (Valle et al., 2003)) and the binding
of protein factors like translational GTPases results in an ordered,
organized sequence of conformational changes of the ribosome,
which are coupled to efficient transport of the tRNA2•mRNA module
through the ribosome.
The key steps of mammalian translation are initiation, elongation, termination and recycling
Translation can be divided into four parts: 1) Initiation, which is
the binding of the very first tRNA, positioning of the mRNA on the
small ribosomal subunit, and joining of the large subunit; 2) iterative elongation cycles, wherein the amino acids coded for in the mRNA
are successively connected to form the peptide chain; 3) termination,
resulting in the release of the peptide chain from the ribosome, and 4) recycling, which is splitting of the associated subunits into small
and large one such that they are ready to be fed in a new round of
translation (Figure 9).
Initiation places the start codon in the P site by ribosome scanning
Initiation is the first step of translation. Here, the small subunit is
prepared for joining with the large subunit (Figure 9, Figure 10).
This preparation includes binding of an initiator tRNAi
Met to the small
subunit P site as well as binding of the mRNA and positioning of the
mRNA start codon into the P site under assistance of initiation factors.
In the next step, the large subunit joins this 40S•mRNA•tRNAi
Met
complex, the remaining initiation factors dissociate, and elongation
can start with the incorporation of the tRNA carrying the amino acid
that is coded for in the second codon.
Eukaryotic and bacterial systems profoundly differ at the stage of
initiation. Bacterial 16S rRNA possesses a sequence, to which the
characteristic Shine Dalgarno sequence of the mRNA aligns. This
alignment facilitates positioning of the mRNA start codon in the P
site of the 30S subunit (Shine and Dalgarno, 1974). Initiation factor
1 (IF1) binds at the 30S A site and induces a structural change in
the 30S subunit (Allen et al., 2005; Carter et al., 2001; Milon et al.,
2008). A ternary complex consisting of fMet-tRNAi
fMet (the first amino
acid in bacterial proteins is always formyl-methionine) and IF2•GTP
binds to the P site, while initiation factor 3 (IF3) ensures that it is
an initiator tRNA and not an elongator tRNA that binds (Milon et
al., 2008). Positioning of the initiator tRNA in the P site is followed
by joining of the large subunit, GTP-hydrolysis of IF2, and finally
dissociation of the initiation factors (Simonetti et al., 2008).
In contrast, in eukaryotes, the positioning of the start codon into
the 40S P site occurs after ‘ribosome scanning’ of the mRNA (Jackson
et al., 2010; Kozak, 1999; Shine and Dalgarno, 1974). The protein
machinery required for eukaryotic initiation is by far more complex than in bacteria, where only three initiation factors are needed
(Hashem and Frank, 2018; Jackson et al., 2010; Kozak, 1999; Shirokikh
and Preiss, 2018).
Eukaryotic initiation starts with the formation of the 43S preinitiation
complex, which consists of the 40S subunit, the ternary complex
eIF2•GTP•Met•tRNAi
Met, eIF3, eIF1 and eIF1A. This 43S complex is
ready to bind to the mRNA, which can be circularized via the 5’-bound
eIF4F that connects to the 3’ end by binding to PABPs. eIF1 and eIF1A
induce an open latch conformation of the 40S that facilitates mRNA
binding, while eIF4G plays a key role in loading the mRNA on the
43S preinitiation complex via interactions with eIF3. The main role
of the now assembled 48S complex is the scanning of the mRNA
until finding a start codon in the correct environment (Jackson et
al., 2010; Kozak, 1999). It is eIF1 that enables the 48S complex to
discriminate the eligible start codon against other codons or start
codons with poor nucleotide context. The establishment of codon-
anticodon base pairing between the mRNA start codon and the tRNA
leads to eIF1 dissociation, allowing GTP hydrolysis and dissociation
of eIF2 under assistance of its GTPase activating protein eIF5. Finally,
eIF5B mediates the joining of the 60S subunit and the assembly of
the elongation competent 80S ribosome is completed when GTP
hydrolysis of eIF5B leads to its dissociation from the 80S (Figure 10).
Additionally to this classical initiation pathway, in the eukaryotic
system a group of RNA structures called IRESs (Internal ribosomal
entry sites) are able to employ alternative initiation pathways
partially or fully independent from the 5’ cap and/or initiation factors
(Pelletier and Sonenberg, 1988; Yamamoto et al., 2017).
Elongation is at the heart of translation
Elongation is an iterative process which is aimed at polymerization
of the peptide chain until all amino acids encoded in the mRNA
are incorporated into the peptide chain. It consists of the steps
decoding/tRNA selection, peptidyl transfer and translocation. At each codon between start and stop, the ribosome must undergo
one full elongation cycle with the result of one amino acid being
added to the peptide chain.
The very first elongation cycle takes place right after initiation and
has as its starting point the assembled 80S ribosome with a Met-
tRNAi
Met in the P site. The A site is empty and must be occupied by
a tRNA carrying the amino acid that is encoded next in the mRNA.
The selection of the correct tRNA requires eEF1A (EF-Tu in bacteria),
a translational GTPase which reaches the ribosome as ternary
complex in association with a tRNA and GTP. The interaction of the
ribosome with the ternary complex is referred to as ‘decoding’. Here,
the tRNA anticodon is brought to the small subunit A site (‘decoding
center’) and interacts with the mRNA codon. Correct base pairing
in case of complementary codons triggers conformational changes
of the ribosome that in turn result in GTP-hydrolysis and eEF1A
dissociation (Budkevich et al., 2014; Schmeing and Ramakrishnan,
2009; Schuette et al., 2009; Voorhees et al., 2010).
The dissociation of eEF1A allows the tRNA to be fully accommodated
in the 60S A site. There, the CCA-end of the tRNA with the
aminoacylated amino acid is positioned in proximity to the CCA-end
of the P-site tRNA that carries the first amino acid, or in later rounds
of elongation the entire peptide chain built so far. During peptide
bond formation, this amino acid/peptide chain from the P-site tRNA
is transferred to the A-site tRNA. As consequence, the ribosome
contains a peptidyl tRNA in the A site, a deacylated tRNA in the P
site, and in case of later elongation rounds, also a deacylated E-site
tRNA (Behrmann et al., 2015). The ribosomal conformation at this
point is characterized by an unrotated (canonical) 40S subunit that
is rolled relative to the 60S subunit (Budkevich et al., 2011, 2014).
It is referred to as the classical PRE state, where PRE means pre-
translocation.
Translocation prepares the ribosome for a new elongation cycle
While the main task of the first half of the elongation cycle is the
polymerization of the peptide chain, the second half serves as
the preparation for the next elongation cycle. Translocation is
the movement of both tRNAs as well as the mRNA, forming the
tRNA2•mRNA module, from the A- and P- to the P- and E sites,
respectively. It is catalyzed by eEF2 (EF-G in bacteria) and leads from
the pre-translocational (PRE) to the post-translocational (POST)-state
ribosome. The POST-state ribosome can then accept a new tRNA in its A site. Alternatively, in case of the very last elongation cycle, the
ribosome does not bind a new tRNA, but enters termination (see
below).
eEF2/EF-G belongs to the group of translational GTPases and is a
five-domain protein (Figure 11). Mammalian eEF2 is very similar
to its homologs from other domains of life (Supplemental Figure 6) The G-domain (or domain I) is responsible for GTP hydrolysis
and possesses the earlier described characteristic switch loops
and G-motifs. Domains 2 and 3 are part of a bridge between the
G-domain and the small ribosomal subunit when the factor is bound
to the ribosome. Domain 4 is a mimicry of a tRNA anticodon arm and
protrudes into the A-site of the ribosome. Domain 4 carries three
functionally important loops: loop 1, facing the tRNA (Ramrath et
al., 2013), loop 2, facing the small subunit body/platform (Ramrath
et al., 2013), and loop 3 in the middle (Figure 11B). A unique feature of domain 4 of the eukaryotic and archaeal elongation factors eEF2
is a diphthamide modification on histidine 715 in mammalia (H699
in yeast) in loop 3 of domain 4 (Oppenheimer and Bodley, 1981).
EF-G/eEF2 function can be specifically targeted by antibiotic agents.
Fusidic acid binds between the G-domain and domain 3 of EF-G. It
occupies the place of the Pi after its release following GTP-hydrolysis
(Figure 11) and prevents EF-G’s dissociation from the ribosome.
The concrete impact of fusidic acid on eukaryotic eEF2 is not fully
understood yet. Sordarin binds between domain 2 and 3 of eEF2
and prevents dissociation of eEF2 in yeast (Figure 11) (Spahn et al.,
2004a).
The diphthamide modification on loop 3 of domain 4 of eEF2 is
known for being the target of toxins like diphtheria toxin and
exotoxin A. When it is ribosylated, eEF2 cannot function in translation
(Davydova and Ovchinnikov, 1990; Oppenheimer and Bodley, 1981).
There exists a current model on translocation based on bacterial
and eukaryotic structures, however, a detailed understanding of the
mechanism has not been (fully) achieved yet. Studies of bacterial
translocation intermediates reveal the following sequence of events:
First, tRNA movement on the large 50S subunit occurs spontaneously
after peptide bond formation which alters tRNA affinities and drives
subunit rotation (Cornish et al., 2008; Valle et al., 2003). This subunit
rotation is reversible and coupled to fluctuations between classical
A/A, P/P states and hybrid A/P, P/E states of the tRNAs and has as
well been visualized in eukaryotic ribosomes (Agirrezabala et al.,
2008; Behrmann et al., 2015; Blanchard et al., 2004; Budkevich et al.,
2011; Moazed and Noller, 1989; Munro et al., 2007).
Only after the tRNAs have reached their hybrid positions, EF-G/
eEF2 comes into play. It contributes to the irreversibility and
directionality of the translocation reaction. eEF2/EF-G probably
binds to the rotated ribosome (Brilot, 2013). According to Rodnina
et al., 1997, already at this early stage and before tRNA movement
has started, GTP-hydrolysis takes place. The next state visualized is
the TI (translocation intermediate)-POST state, where the tRNAs are already translocated on the 30S body/platform and adopt chimeric
hybrid (ap/P, pe/E) positions. The ribosome at this state adopts a
partly rotated conformation and exhibits a high-degree head swivel
(Ramrath et al., 2013; Ratje et al., 2010; Zhou et al., 2014) (Figure 12).
After completion of translocation, EF-G dissociates. The ribosome
can now accept the next tRNA.
It is not clear how exactly EF-G/eEF2 and GTP-hydrolysis contribute
to translocation. Two opposing models were suggested, 1) the
‘Brownian ratchet’ model, according to which binding of EF-G/
eEF2 to the ribosome suffices to deflect the ribosome’s natural,
thermodynamically driven propensity to backrotate, resulting
in translocation (reviewed in (Spirin, 2009)). 2) The power stroke
model, in which the energy of GTP-hydrolysis is used by eEF2/EF-G
to actively push the tRNAs in the direction of translocation (Rodnina
et al., 1997; Chen et al., 2016).
Termination releases the peptide chain and is followed by recycling
Usually, the last codon of the mRNA is followed by a stop codon
(UAA, UAG or UGA). When this stop codon is positioned into the A
site, no canonical tRNA will match it. The stop codon is recognized by
class-1 release factor eRF1 (RF1 and RF2 in bacteria) which facilitates
release of the peptide chain from the P-site tRNA. The activity of
eRF1 is supported by class-2 release factor eRF3 (RF3 in bacteria),
which belongs to the group of translational GTPases.
After termination, the ribosomal subunits dissociate and are then
reused for the next round of translation. This process is called
ribosome recycling. In bacteria, ribosomal recycling factor (RRF), EF-G
and IF3 act together to disassemble the 80S ribosome (Hirashima
and Kaji, 1970). In eukaryotes, ABCE1 splits the 80S ribosome
(Jackson et al., 2012; Pisarev et al., 2010). Ligatin (also known as
eIF2D) and DENR (density regulated protein) have been found to
promote dissociation of tRNA and mRNA from the small subunit in
eukaryotes (Skabkin et al., 2013).
Some evidence points towards an alternative event after termination.
It is referred to as ‘reinitiation’: Here, recycling and dissociation of
the 60S subunit takes place as well, but the 40S subunit does not
leave the mRNA. Instead, it continues with scanning and thus can
translate a next open reading frame (ORF; see Figure 4B) (Jackson
et al., 2012; Skabkin et al., 2013).
mRNA quality control prevents production of degenerated proteins
Corrupt mRNA will lead to defective protein products. To avoid
mistakes in protein translation, the cell has developed multi-level
control mechanisms to check for integrity and correctness of the
mRNA. Already mRNA transcription and maturation are susceptible
to errors, and control points at this level are there to detect and
eliminate defective mRNA products. In the nucleus, aberrant mRNAs
are degraded in the 5’ to 3’ direction by exoribonuclease Xrn2 and
in the 3’ to 5’ direction by the nuclear exosome before reaching the
cytoplasm (Fasken and Corbett, 2009). In the cytoplasm, the ribosome
and protein factors are involved in controlling the translated mRNA
in three main ways:
Nonsense-mediated mRNA decay takes place when there is a
premature stop codon. Downstream of the premature stop codon,
the exon junction complex contains the upstream frameshift
proteins (UPF) 2 and 3. Upon recognition of the stop codon, UPF1
is recruited. The interaction of UPF1 with UPF2 activates the mRNA
degradation process (Isken and Maquat, 2007).
Non-stop mRNA decay is induced by the absence of a stop codon. The
ribosome is stalled at the 3’ end of the mRNA because termination
factors are not recruited (Isken and Maquat, 2007). Such stalled
ribosomes are recognized by a mechanism that is not yet clearly
understood, but apparently involving Dom34•Hbs1 (Hilal et al.,
2016; Tsuboi et al., 2012). The exosome is recruited to the ribosome
and degrades the mRNA.
In some cases, the ribosome cannot continue translation due to
stable secondary structure. The mechanism that rescues a ribosome
in this situation is referred to as no-go mRNA decay. In yeast, a
Dom34•Hbs1•GTP complex is able to mediate dissociation of such
stalled ribosomes (Becker et al., 2011; Shoemaker et al., 2010).
Translation is subject to multiple layers of regulation
Translation offers many levers for regulation. The pool of ribosomes
that can enter translation is determined by the production,
processing and modification of rRNA and ribosomal proteins and
their assembly in the nucleus. The actual synthesis of a translation-
competent ribosome, followed by nuclear export and maturation
in the cytoplasm, are long and complex processes and sensitive
to many influences (Karbstein, 2011; Nierhaus, 1991; Wilson and
Nierhaus, 2007). Their regulation controls the cell’s basic disposition
to perform translation. Similarly crucial to the synthesis of ribosomes
is the synthesis of factors that are involved in translation.
The actual accessibility of both ribosomes and factors is the next layer
of control. For example, 80S monosomes were found to bind eEF2,
but not to be translationally active (Khatter et al., 2015; Voorhees et
al., 2014); the 40S subunit in these complexes is thus not accessible
for translation initiation. Stability of an 80S•eEF2 complex has also
been observed in vitro (Budkevich et al., 2014; Davydova et al.,
1993). An example for the control of protein factors is the eukaryotic
initiation factor eIF4E, which can be bound and thus inactivated by
eIF4E-binding protein (4E-BP), whose affinity is regulated by post-
translational phosphorylation; initiation is reduced then by the
decreased availability of eIF4E (Bah et al., 2015; Marcotrigiano et
al., 1999). Also eEF2 is known to be inactivated by phosphorylation
(Ling and Ermolenko, 2016).
Besides such quite simple mechanisms that are based on the
accessibility of substrates, there might exist a more complex machinery that is aimed to enhance the production of specific
proteins and down-regulate others. Whereas in long-term, the
proteome of a cell is controlled by transcription, dynamic, rapid
adaption mechanisms could base on differential translation. How
this works exactly is not clear; discussed is among others the
existence of ‘specialized ribosomes’ (Xue and Barna, 2012). An
indicator for a possible regulation mechanism is that ribosomal
proteins can be modified post-translationally. The ribosomal protein
with the longest history of investigations of its posttranslational
modification is ribosomal protein eS6, which is phosphorylated and
whose putative impact on translation is one of the questions raised
in this thesis (see below). Also, the topology of translation in the cell
and the composition and architecture of polyribosomes (see below)
might be a dynamic mechanism to alter the translatome.
Actively translating ribosomes are organized into polysomes
It is the normal case that on one mRNA, multiple ribosomes are
translating the message at the same time and that depending on
the length of the mRNA, multiple initiation events happen before
the first ribosome reaches the stop codon.
Such assemblies of multiple ribosomes on the same mRNA are
called polyribosomes or polysomes. Each ribosome that is part
of a polysome group is at some stage of translation (Figure 13).
Elongation intermediates are the by far most often sampled states,
because the elongation cycle must take place for each codon
between start and stop in contrast to initation, which takes place
only at the start codon, and termination, which takes place only at
the stop codon.
By isolating polysomes ex vivo, Behrmann et al. were able to
reconstruct ten different states of mammalian elongation (Behrmann
et al., 2015). The differential population of the states reflects the
distribution of functional states in polysomes. Although the time
between purification of the polysomes used for analysis and the freezing of the sample might allow for changes, that work shows
the in vivo energy landscape of translation as close to the native
state as possible. Of special interest for studying the regulation of
translation is the distribution of functional states (Figure 13). The
captured states by far don’t represent the complete spectrum of
possible conformational and functional states of the mammalian
ribosome during elongation, but only local minima. Referring to
the nomenclature of the ‘dynamics‘ section, the states represent
fluctuations in the macro- to mesoscopic range (Munro et al., 2009).
The shapes of polysomal assemblies have been extensively studied
(Afonina et al., 2013, 2014; Brandt et al., 2010; Myasnikov et al., 2014;
Viero et al., 2015). The relative orientations of the ribosomes in a
polysomal assembly raise the question of how ribosomal proteins
or RNA on the solvent side might promote these orientations via
specific inter-ribosomal contacts. Moreover, it was observed that the
abundance of rectangular shapes is associated with a low translation
activity (Myasnikov et al., 2014; Viero et al., 2015) and that it can
be increased by treatment of cells with rapamycin or by serum-
withdrawal (Viero et al., 2015). Change in the ratio of ribosomes to mRNA can also modify the pattern of proteins synthesized (Lodish,
1974). Polysome patterns after post mitochondrial supernatant
(Duncan and McConkey, 1982) as well as investigations of the shapes
of polysomes (Myasnikov et al., 2014; Viero et al., 2015), suggest that
polysomes react to different conditions, like serum withdrawal, by
changing their shape and/or composition.
In eukaryotic cells, polysomes can be additionally differentiated by
the cellular compartment they are attached to. Essentially, there
are cytosolic polysomes and endoplasmatic reticulum (ER)-bound
polysomes. So far, it is agreed upon that every ribosome has the
potential to join either class and that it is the signaling peptide
encoded in the mRNA that is responsible for recruiting the ribosome
to the ER membrane (Meister, 2011).
Phosphorylation of ribosomal protein eS6: a possible switch for translation regulation?
Among the many discussed possibilities of how translation might
be regulated, there are post-translational modifications of ribosomal
proteins (Xue and Barna, 2012). Some ribosomal proteins undergo
phosphorylation, e.g. ribosomal protein eS6 (eS6), a eukaryote-
specific protein of the 40S subunit located at the foot of the 40S
body/platform (Figure 3A). eS6 is 249 residues long in humans and
consists of a globular part and an alpha helical part with a flexible
C-terminus (Figure 14).
eS6 is a necessary protein for ribosome biogenesis. Its conditional
deletion has been shown to lead to a p53-dependent inhibition of
cell cycle progression (Panić et al., 2006; Sulić et al., 2005; Volarevic, 2000) in multiple tissues.
The alpha helical, C-terminal part of eS6 reaches into the vicinity
of expansion segment 6 of the 18S rRNA and displays five serine
residues (S235, S236, S240, S244, S247) at its C-terminus, which are
the substrates of four independent kinases (RSK, Protein kinase A,
S6K and CK1) with partially overlapping specificities (Bandi et al.,
1993; Krieg et al., 1988; Wettenhall and Morgan, 1984) (Figure 15).
Phosphorylation happens in an ordered fashion, such that first, the
residues serine 235 and serine 236 are phorsphorylated, then serine
240 and serine 244 and last serine 247 (Martin-Pérez and Thomas,
1983; Wettenhall et al., 1992). Phosphorylation of serine 247 requires
prior phosphorylation of serines 240/244, and phosphorylation of serine 247 in turn promotes/stabilizes phosphorylation of serines
240/244 (Hutchinson et al., 2011). The modification is counteracted
by the action of phosphatase (PP) 1 which is responsible for
dephosphorylation at all five sites (Barth-Baus et al., 2002; Belandia
et al., 1994; Hutchinson et al., 2011; Li et al., 2012).
The phosphorylation of the five serine residues at the C-terminus is
massively increased in regenerating liver cells by partial hepatectomy,
which was the first model for studying eS6-phosphorylation
(Gressner and Wool, 1974). In the context of growth, two pathways
lead to eS6 phosphorylation: The PI3K/Akt/TCS/Rheb/mTORC1/
S6K pathway and the Ras/Raf/MEK/ERK/RSK pathway (Figure 16)
(reviewed in (Meyuhas, 2008, 2015)). A large number of stimuli have
been shown to induce eS6 phosphorylation via these pathways,
including stimulation of serum-starved cells with serum (Meyuhas,
2008, 2015; Roux et al., 2007).
As to the consequences of this modification, many observations
have been made that are thought to be associated with eS6
phosphorylation, but none of them can be explained mechanistically.
In 2005, Ruvinsky and colleagues found that global protein synthesis
is higher in knockin mouse embryonic stem cells (MEFs) (P-/-)
compared to wild type MEFs, but these observations could not be
reproduced by using S6K-deficient mice (S6K1 -/-, S6K2 -/-) (Chauvin
et al., 2014; Mieulet et al., 2007; Ruvinsky et al., 2005). Many cell-
types derived from eS6P-/- mice are significantly smaller than in the
wild type, among them pancreatic beta cells, IL7-dependent cells
from fetal livers, MEFs, and muscle myotubes (Granot et al., 2009;
Ruvinsky et al., 2005, 2009). However, some cells have normal size,
for example acinar cells from pancreas (Pende et al., 2004; Ruvinsky
et al., 2005). eS6P-/- mice have impaired renal hypertrophy after
unilateral nephrectomy (Xu, 2015). Interestingly, there seems to
be a link to initiation, as phosphorylation of serine 247 promotes
association with mRNA Cap-binding complex in vitro (Hutchinson
et al., 2011), and phosphorylation of serines 240/244 is required for
Cap binding (Roux et al., 2007). Further, by covariance analysis of a cryo-EM map of a 43S initiation complex, density variance in the
eS6 region was shown to be related to density variance of initiation
factors (Liao et al., 2015) (the sample analyzed was (Hashem et
al., 2013)). Nevertheless, if there is a clear structural role of eS6
phosphorylation is not known.
Single particle cryo-EM as a tool in structural biology
In cryogenic transmission electron microscopy (cryo-EM), a two-
dimensional (2D) projection is generated from a thin vitrified
specimen through which an electron beam is sent. In order to
reconstruct the three-dimensional (3D) volume, multiple viewing
angles of the same object must be covered. To this end, the specimen
can either be imaged from different angles by tilting it, as done
in cryo-EM tomography, or a specimen that is imaged at a fixed
angle of 0° must contain multiple copies of the object in different
orientations. The latter approach is used in single particle cryo-EM,
which will be discussed in the following paragraphs.
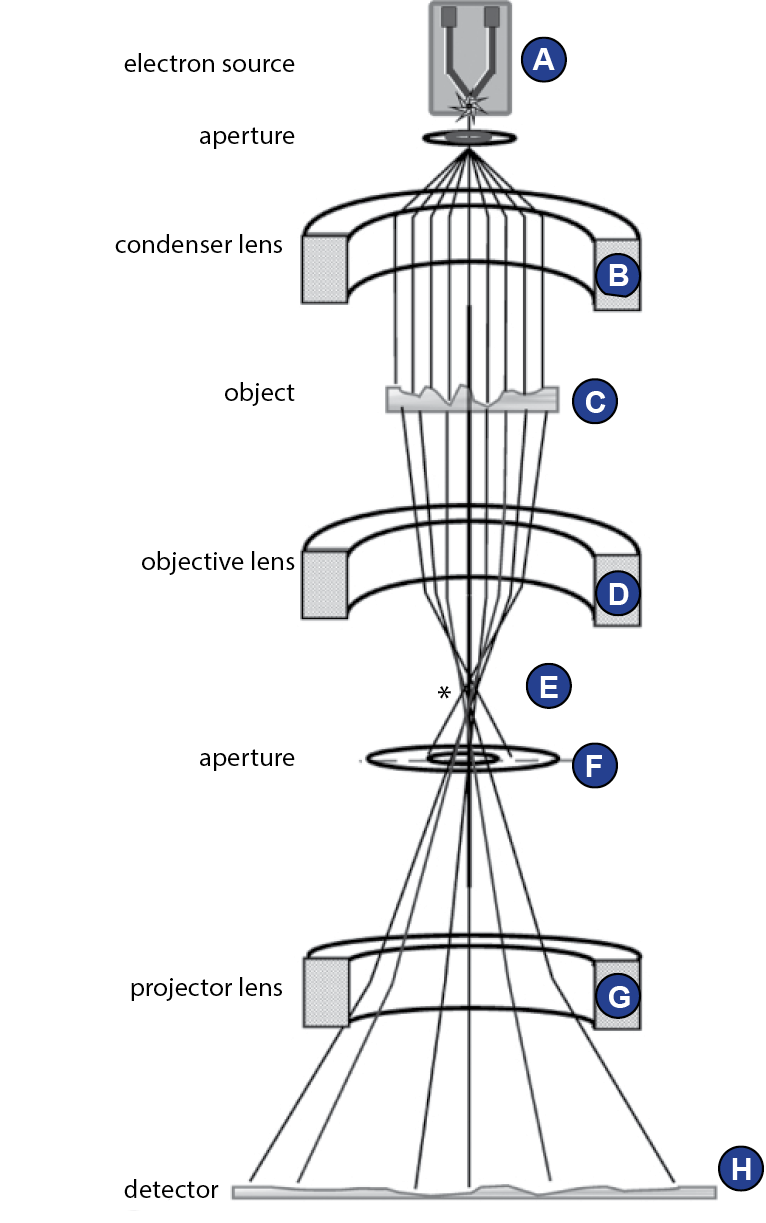
Construction of the transmission electron microscope
The interior of a transmission electron microscope (TEM) is
evacuated. Electrons are emitted from the cathode, or electron gun
(Figure 17A). Because electrons interact with an electromagnetic
field, they can be focused using magnetic lenses. The condenser
lens (Figure 17B) transforms the emitted electrons to a parallel
beam. The following acceleration of the electrons in the column
is directly coupled to a theoretical point resolution limit, as will
be explained below. Nowadays, usually 120-300 kV microscopes
are used for single particle cryo-EM. The object (Figure 17C) is
inserted into the column via a vacuum lock. The incident wave is
modified by the object such that it carries the information about
the object’s structure. The ojective lens system (Figure 17D) focuses the scattered wave to form the real image. The focused beam forms
the Fourier transform/diffraction pattern of the wave in the back
focal plane (Figure 17E). A phase plate can be inserted here to shift
the phases (Orlova and Saibil, 2011). As high frequency information
is scattered at high angles, at this point the size of the objective
aperture plays an important role (Figure 17F). The projector lens
system contains several magnification lenses (Figure 17G). To
exclude electrons of certain energies (e.g. those that lost energy and
changed wavelength due to interactions with the sample), which
would otherwise reduces image quality, an energy filter can be
used. Finally, the electron wave reaches the detector (Figure 17H).
Figure-17:
Elements of the transmission electron microscope. | Schematic representation of a transmission electron microscope. (A) electron source, (B) aperture, (C) object, (D) objective lens, (A) back focal plane, (C) aperture, (C) projector lens, (C) detector. The electron gun is the source of the electron beam. The parallel electron beam passes through the specimen. Behind the objective lens, in the back focal plane, the diffraction pattern of the specimen is formed. Projector lenses magnify the image. Figure adapted from (Orlova and Saibil, 2011).
Cryogenic transmission electron microscopy allows imaging of biological specimens
The distinctive feature of cryo-EM versus other structural methods
is that it allows imaging of biological samples at near-native
conditions. The specimen is plunge frozen in liquid ethane, a process
that happens so fast that the hydration state of the molecule and
its native conformation are unaffected (Dubochet et al., 1988). The
molecules are now embedded in a thin layer of amorphous ice
and can be imaged in the microscope. Additionally to the basic
elements of a TEM described above, the cryo-TEM must ensure that
the specimen is steadily kept at a temperature of below -180° C.
Therefore, the specimen is inserted into the column via a special
cryo-holder where it is kept in liquid nitrogen. The microscope is
cooled with liquid nitrogen or sometimes helium.
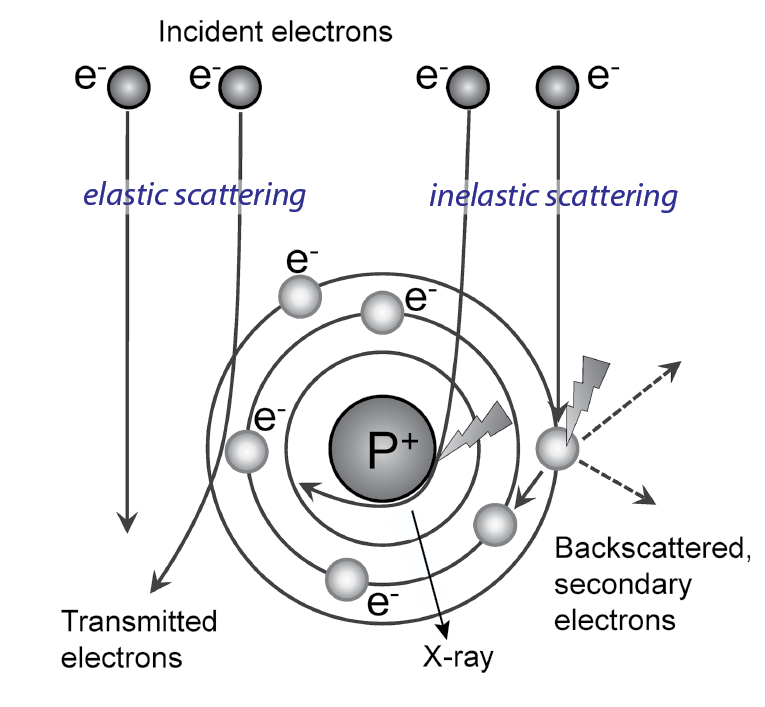
Interaction of the electrons with the sample
Electrons can interact with the specimen or pass through it without
interaction. If the electron passes without interaction, no information
about the specimen is gained, and it contributes to background. The
changes that occur to the electron by interacting with the sample
make it carry information about the sample. In case of interaction,
two types are distinguished: elastic and inelastic scattering.
When scattered elastically, the electron is deflected by the Coulomb
potential of the specimen atoms without loss of energy. The
deflection is expressed in a change of phase of the electron wave
(Figure 18). Elastic scattering is the main interaction of electrons
with biological specimens, which consist of light atoms (H, C, N, O,
P, S). Elastic scattering contributes to phase contrast.
In inelastic scattering, the passing electron transfers energy to the specimen
and both energy and phase of the electron change (Figure 18).
The lower the kinetic energy of the electron (e.g., at low voltage),
the higher is the probability of inelastic and elastic scattering
events. The general probability of electron-sample interaction
and thus signal-to-noise ratio can be enhanced by increasing the
electron dose. However, transfer of energy from the electron to the
sample is associated with sample damage (Egerton et al., 2004). Low dose conditions with mean exposure of 20-30 electrons per Å2 are
therefore usually applied for cryo EM of biological samples to limit
the damage. To obtain a meaningful signal nevertheless, cryo-EM
single particle analysis uses many low dose measurements of copies
of the sample, which are then summed up (Cheng et al., 2015; Frank
et al., 1992).
Figure-18:
Electron-specimen interaction. | Schematic depiction of the interaction patterns of electrons with an atom in the sample; elastic and inelastic scattering. Figure modified from (Orlova and Saibil, 2011).
Cryo-EM of biological specimens is dominated by phase contrast
Image detectors record the electrons that hit a pixel. Because of
the negligible amplitude loss in biological material and under the
necessary low dose conditions, there will be almost no contrast
visible for an image taken by an ideal cryo-TEM in focus.
There are two ways to solve this problem:
To use heavy atoms to increase amplitude contrast. For example,
in negative staining, uranylacetate is used to stain the outside of the
particles, such that one obtains a ‘negative’ (as example, see Figure
45). This is often done for screening of a sample and is justified for
determining the overall shape of a particle, but will not yield high
resolution.
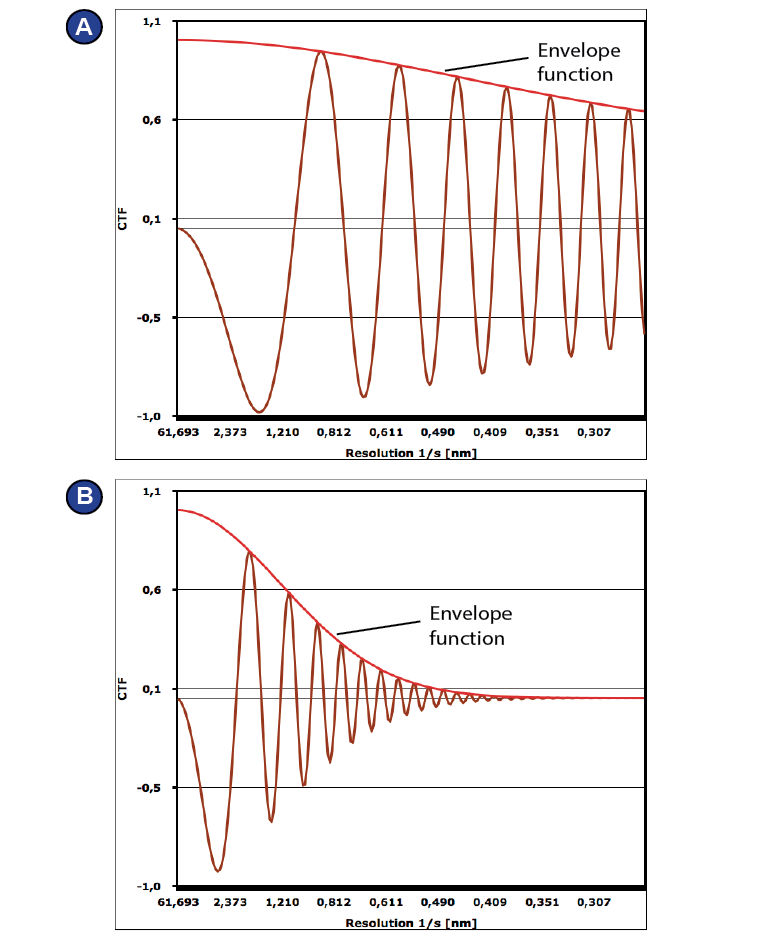
To optimize the (phase) contrast transfer function (CTF), which
describes the relation between the original image and the one that
is detected and contains microscope-specific information. It is the
convolution of the sinus of the aberration function χ(f) (1) and an
envelope function E(f) that represents the dampening of the signal
(de Jong and Van Dyck, 1993) (2). The aberration function χ(f)
depends on the spatial frequency f, the wavelength λ, the spherical
aberration Cs, which is microscope-specific, and the defocus δ, which can be adjusted via the objective lens current (de Jong and
Van Dyck, 1993) (1). The envelope function depends amongst others
on the defocus and on the electron source.
Images are usually not taken in focus. Instead, a defocus (δ) is
employed, which increases the phase shift of the scattered vs.
the unscattered beam. The efficiency by which the CTF transfers
information depends on the spatial frequency and is different for different defocus values (Figure 19). Some information is missing
completely, namely at each zero crossing. To compensate for this
selective loss of information, images are usually taken at different
defocus values, e.g. in a range of -500 to -2500 nm. Later, the exact
defocus is recalculated for each micrograph (sometimes, even
for each particle) and used for correction of the images during
processing.
Figure 19:
The CTF depends on the defocus. | CTF curves simulated using CTF simulation: https://c-cina.unibas.ch/tools/soft/ctf-simulation/. The default parameters were used, voltage was set to 300 kV. (A) -600 nm defocus (B) -2300 nm defocus.
Spherical aberration (Cs) means that the electron beam is not focused
exactly by the objective lens; instead, different components meet
the optic axis at different heights, contributing to phase contrast as
well.
By adjusting the defocus, χ(f) can be optimized such that the
transferred contrast is enhanced. The samples presented in this
work were all imaged employing this approach of taking images in
defocus for enhancing phase contrast.
Another way of enhancing phase contrast is borrowed from light
microscopy and consists in the usage of a phase plate (the term
‘Volta phase plate’ is often used in cryo-EM, in light microscopy the
term ‘λ/4-plate‘ is used). It delays part of the electron beam and thus
enhances the phase shift such that it can be measured as intensity
(Zernike, 1942). Phase plates are not essential for visualizing large
molecular assemblies like the ribosome, but their optimization and
introduction into the field of cryo-EM nowadays allows visualization
of very small molecular complexes that can hardly be realized when
employing defocus variation (Danev and Baumeister, 2017).
Direct electron detectors contributed a great deal to the ‘resolution revolution’
The establishment of direct electron detectors contributed a great
deal to the improvement of resolution in cryo-EM. Single electrons
can be detected by these cameras, which possess a very thin active
layer from which individual diodes can read single pixels (Faruqi
McMullan, 2010). The key is that the incoming electrons are recorded
as change in the potential of the diodes and not first converted to light by scintillators as in old CMOS detectors. The point spread
function (PSF) is therefore much smaller and the position of the
incoming signal is recorded with a higher accuracy and a higher
signal-to-noise ratio.
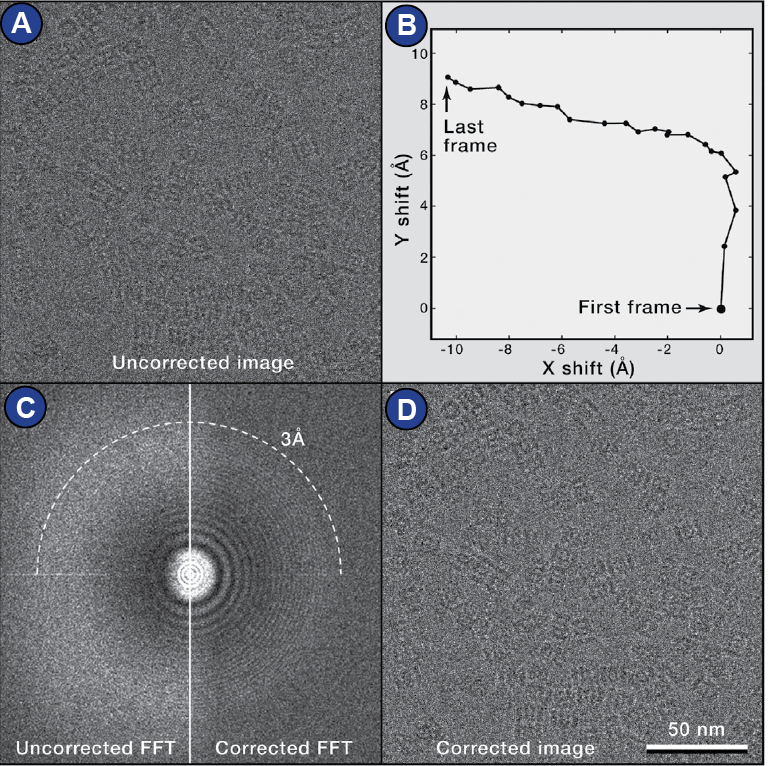
The current state of the art is that images are collected as multiple
frames (movie mode). Thus, beam-induced motion of the sample
can be compensated by realigning the movie frames, a process that
is called motion correction (Cheng et al., 2015; Zheng et al., 2017)
(Figure 20).
Figure 20:
Motion correction. | (A) Raw (without motion correction) cryo-EM micrograph of archaeal 20S proteasome particles. (B) Trace of movement of the movie frames. (C) Left: Power spectrum calculated from the sum of the raw movie frames. Right: Power spectrum calculated from the sum of movie frames after motion correction. (D) Motion corrected micrograph. Figure adapted from (Cheng et al., 2015)
Speed is also an important factor: The K2 Summit camera (Gatan),
for example, has a sampling rate of ~400 images per second,
enabling the detection of single events (incoming electrons). Such
event is recorded over the whole detector area, of which each pixel
detects a different intensity. Additionally to an intensity maximum
in a certain pixel, the surrounding (weaker) intensities are measured
by the neighboring pixels and thus the position relative to the
maximum inside the pixel itself (quadrant-wise) can be recovered.
Superresolution mode takes advantage of this and leads to a
theoretically halved pixel size (Figure 21).
Figure 21:
Superresolution mode of the K2 Summit camera (Gatan). | (A) The electron enters the detector (B) The electron signal is scattered. (C) Charge collects in each pixel. (D) The event is localized in sub-pixel accuracy. Figure adapted from http://www.gatan.com/improving-dqe-counting-and-super-resolution.
Image processing leads from 2D projections to 3D volumes
The particle images that are recorded present 2D projections
formed by sending a set of parallel beams through the specimen.
The intensity recorded by each pixel can be interpreted as the sum
or integral of the object’s intensities along the beam.
The information that a 2D projection image contains can be
described by the sum of different wave functions. Low frequency
information contributes to the overall shape of structures in the
image, like the rough outline of a ribosomal particle, whereas high
frequency information contributes tofine details, like the position of
single residues.
The Radon transform (Radon, 1986 -originally published in 1917)
describes the function that calculates the integrals of a 2D image at given angles and thus disassembles the 2D image in its projections.
Importantly, if all angles are completely covered, an object can be
completely reconstituted from its projections using the inverse
Radon transform. The inverse Radon transform is the approach that
in principle is used to obtain 3D reconstructions of the molecules
imaged by cryo-TEM, only that the set of projections from a cryo-
EM experiment is not 100% complete. Moreover, the data contains
noise that might interfere with high-frequency information.
To carry out inverse Radon transform from experimental data,
several methods can be used: 1) Filtered backprojection, where
the 2D image is smeared along the projection axis in real space, 2)
Fourier interpolation, where the Fourier transforms of the projection
are interpolated in Fourier space, forming the Fourier transform of
the reconstructed image, which is then inverse Fourier transformed.
A high-pass filter (e.g., ramp filter) can be applied to the Fourier
transforms to unblur the resulting image. 3) Algebraic reconstruction
technique (ART), where the reconstruction problem is formulated as
a large set of equations that are then iteratively solved (Kaczmarz,
1937).
However, for these methods, of which nowadays Fourier
interpolation is most commonly used for cryo-EM reconstructions,
the angles from which the projections were generated must be
known. Therefore, a key procedure in single particle cryo-EM is the
finding and optimization of the orientation parameters (see below).
Notably, a single projection image has a very low signal to noise
ratio. Therefore, similar projections can be grouped to one image
stack. Subsequent class averaging improves the signal-to-noise ratio.
2D classification of particle images is a good start when handling
data of which the 3D structure is unknown. From these 2D classes
or a selection, an ab initio reconstruction can be calculated by back-
projecting the 2D images to guess a 3D volume, which over several
rounds of comparison with the backprojections is improved.
In case that one has already an idea of the structure, this step can be
skipped and one can proceed with refinement and sorting.
Refinement is the optimization of the orientation parameters. In the
approach of projection matching, cross-correlation or maximum
likelihood methods are used to compare the original projection
images with computed projection images of the reconstructed
volume/the reference.
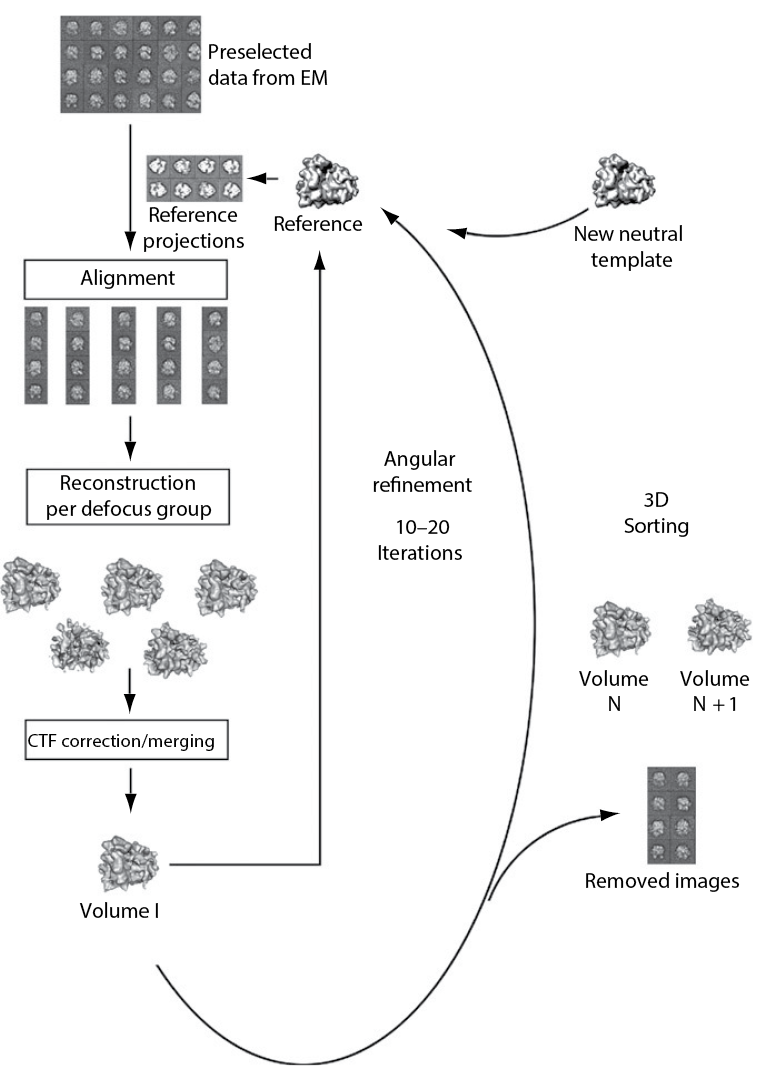
Sorting means that one splits the dataset into subpopulations in case
of heterogeneity of the sample. The ribosome is a good example
for an object that gives quite heterogeneous datasets because of
its intrinsic dynamic described above (subunit rotation, head swivel,
etc.). Large differences can be sorted by adding a neutral reference,
for example an empty, strongly filtered volume (Figure 22). Smaller,
more local differences can be unveiled by masking the region of
interest and comparing reference projections obtained through this
mask (focused reassignment) (Penczek et al., 2006).
Pitfalls to avoid when calculating a structure are reference bias
and overrefinement. Reference bias means that noise can align to
features of any given reference volume and reproduce it (example:
Mao et al., 2013). Therefore, the reference must be chosen with care,
optimally it is a volume coming from the dataset itself by ab initio
reconstruction, and it must be low pass filtered. Filtering is also
important for avoiding overrefinement, that means that noise in
the images aligns to fine structure of the reference projections and
thus distorts the overall result.
Figure 22:
The final maps and resolution limits of cryo-EM
Both the hardware (the microscopes and the image detectors) and
the software that is used to reconstruct the 3D volume from 2D
projections have been optimized in the past years and the slogan
‘resolution revolution’ has become very popular to describe the
improving quality of single particle cryo-EM structures (Kuhlbrandt,
2014).
In analogy to light microscopy, the theoretical resolution limit of a
transmission electron microscope is directly coupled to the wave
length. In a 300 kV microscope, the electron gains a kinetic energy of 300 keV, and its wavelength is 1.969 pm according to formula (3)
(Relativistic formula for the calculation of velocity, where λ is the
wavelength, h is the Planck constant, E is the energy, m0 is the rest
mass of the electron, E0 is the rest energy of the electron (Reimer
and Kohl, 2008)). One possible way of estimating the resolution limit
of a (light) microscope is to use Abbe’s equation (4) (Lipson et al.,
1995). For a microscope with a numerical aperture NA=0.01 and light
at the wavelength λ=1.969 pm, the theoretical point resolution limit
would be ~0.99 Å: atomic resolution.
This example of Abbe’s equation illustrates the potential of an EM
compared to a light microscope due to the difference in wavelength.
However, for estimating the resolution of a final map, the point
resolution of the microscope does not play any role. Instead,
statistical measures are used.
The final map’s resolution is based on self-consistency of two raw
(unfiltered) half maps: In Fourier space, the Fourier transforms of
the half maps are compared pixel by pixel using cross correlation
along the radius (representing the spatial frequency) of the Fourier
shells. As result, correlation values (FSC) are found for each spatial
frequency. The spatial frequency that falls below the threshold of
0.143 FSC is defined as the last spatial frequency with a sufficient
correlation value, and thus all information that is in a higher
frequency range is considered unreliable because it contains more
noise than signal (Rosenthal and Henderson, 2003). The reciprocal
spatial frequency corresponds to the resolution (Examples in the
results section, Figure 28, Figure 40, Figure 50, Figure 51).
In practice, the resolution and, importantly, the quality of the final
map that is obtained of a biological object depends on many factors.
During the first half of 2018 (01/01/2018-01/07/2018), there was only one structure released in the EM-database (http://emsearch.rutgers.
edu) from single particle cryo-EM of less than 2 Å resolution. It was
the structure of beta-galactosidase at 1.9 Å (Bartesaghi et al., 2018).
423 structures had a resolution between 2-5 Å, and the number of
structures greater than 5 Å was 221. The structure with the currently
best resolution deposited in the EM-database is reported to have 1.6
Å resolution (Danev R, Yanagisawa H, Kikkawa M Cryo-EM structure of
mouse heavy-chain apoferritin at 1.62 Å). Usually, biological objects
reach a high resolution when they are very symmetric and exhibit a
low degree of flexibility.
Finally, it is important to note that the estimation of the resolution
of a cryo-EM structure is based on conventions which not the
entire community agrees upon (van Heel and Schatz, 2005, 2017)
and which are susceptible to distortion by improper refinement
(e.g. ‘overrefinement’ or model bias). One number is not enough to
entirely and reliably assess the quality of a cryo-EM reconstruction.
Also the local resolution is important, especially local resolution of
factors or any regions that are important for answering the biological
question asked when imaging the given molecule.
The technical advances of the recent years resulting in an improved
quality of cryo-EM maps makes it possible to model structures
at near atomic resolution. De novo atomic modeling, so far only
possible in X-ray crystallography, can now be done using cryo-EM.
That means that at its current state, cryo-EM can be used to actually
solve a structure.
1. Summary/Zusammenfassung
Subsections of 3. Aims
Aim 1
To visualize and mechanistically understand mammalian translocation.
Translocation is one of the least understood processes in protein
biosynthesis. Its correct completion is crucial for the continuation of the
translation elongation cycle, and ultimately for protein synthesis. As upon
translocation, the contacts between the ribosome and the tRNA2•mRNA-
module extensively rearrange, it is a process which requires utmost
accuracy. Efficient translocation depends on the action of the specialized
GTPase eEF2; however, detailed insights into the mechanism, by which
eEF2 catalyzes translocation is lacking and opposing hypotheses are
vividly discussed: The Brownian ratchet model, in which eEF2 is supporting
intrinsic conformational changes that lead to translocation, and the power
stroke model, according to which eEF2, being a motor protein, actively
moves the tRNAs in the direction of translocation (Chen et al., 2016; Liu et
al., 2014; Rodnina et al., 1997; Spirin, 2009).
Moreover, structural knowledge on tRNA translocation is dominated by
studies carried out in the bacterial system, and structural data on mammalian
tRNA translocation does not exist. Therefore, this work is dedicated to
studying how translocation is performed in the mammalian system, using
an in vitro reconstitution of a rabbit 80S•tRNA2•mRNA•eEF2•GMPPNP complex. The goal is to obtain structures of mammalian translocation
intermediates to characterize mammalian translocation and compare it to
translocation in the bacterial and yeast system.
Aim 2
To investigate the 80S•tRNA2•mRNA•eEF2•GDP complex that is observed upon addition of eEF2•GTP to a programmed PRE complex.
To understand why eEF2 can stably bind to ribosomes and two tRNAs in vitro (Budkevich et al., 2014), and how this fits to the model of translocation,
I look at an in vitro reconstituted rabbit 80S•tRNA2•mRNA•eEF2•GDP
complex.
Aim 3
To revisit the mammalian polysome landscape to find out if serum deprivation influences the distribution of states.
Cryo-EM of actively translating polysomes gives insight into the energy
landscape of mammalian translation (Behrmann et al., 2015). Among other
stimuli, serum deprivation and subsequent serum restimulation has been
hypothesized to influence translation, e.g. via changing polysome patterns
(Duncan and McConkey, 1982; Viero et al., 2015). I want to investigate if
overnight serum starvation and 30 minutes of serum deprivation can
change the energy landscape of translation.
Aim 4
To look at the phosphorylation site of ribosomal protein eS6 and its possible impact on its surrounding structures to find out the role of eS6 phosphorylation.
The investigation of structural changes induced by eS6 phosphorylation
is the fourth aim of this thesis. eS6 is a eukaryote-specific protein of the
40S subunit. It undergoes phosphorylation in response to various stimuli,
including serum deprivation/restimulation. Surprisingly, there are almost
no works tackling the role of eS6 phosphorylation from a structural
perspective. Since structural information on the eukaryotic ribosome from
crystal structures and cryo-EM density maps have emerged in the last
years, eS6 could be structurally characterized in yeast and recently also
in mammalian ribosomes. However, the last residues of the C-terminus of eS6, including all five phosphorylatable serines, are missing in the
available structures, and similarly the neighbouring expansion segments
are not well resolved, such that the phosphorylation and its structural
consequences are not characterized yet (Behrmann et al., 2015; Ben-Shem
et al., 2011). This thesis aims to investigate the C-terminal region of eS6
and its surrounding.